Data Visualization
How to build customized data visualizations using Lucid's advanced diagramming features
Lucid offers a suite of powerful data backed tools for users to create powerful visualizations of their data. This guide will cover many of the options that can be leveraged through the Extension API to automatically set up powerful diagrams at the press of a button. The end result of the guide will be a "Rental Car Manager" extension which generates data about rental cars, and visualizes those cars as custom shapes.
This guide is meant to be used alongside our starter project which you can find here. The guide will walk through building the following features:
- Creating a modal with a custom UI in Lucid's editor
- Adding data sets to Lucidchart's data linking panel
- Creating custom, data backed shapes on the canvas
You can find the finished result as code (UPDATE WITH ACTUAL LINK) and in our marketplace where you can install it to demo.
Getting started
To get started, clone the stater repo, then install its dependencies:
/rental-car-manager$ cd editor-extensions/rental-car-manager
/rental-car-manager/editor-extensions/rental-car-manager$ npm install
/rental-car-manager/editor-extensions/rental-car-manager$ cd angular
/rental-car-manager/editor-extensions/rental-car-manager/angular$ npm install
Now you can start the development servers. There are two servers you need to start:
Angular development server
This extension uses the Angular frontend framework to provide a user interface. Start the Angular development server:
/rental-car-manager/editor-extensions/rental-car-manager/angular$ npx ng serveEditor extension development server
You will also need to run the editor extension development server:
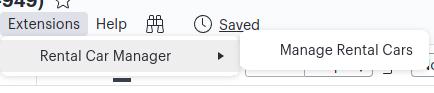
/rental-car-manager/editor-extensions/rental-car-manager$ npx lucid-package@latest test-editor-extension rental-car-managerWith those running, you can now open a new Lucidchart document to get started developing. You can tell it's working if you can see an "Extensions" menu in your top bar with a "Rental Car Manager" option:
Creating modals and panels in Lucid's editors
This extension needs a UI which users can use to configure the data visualization. In this case, we want users to be able to construct an imaginary fleet of rental cars, and car lots which will be visualized. Lucid offers multiple entry points for custom UIs.
In this case we are going to use a modal. Create a new file in the /modal subdirectory called rentacarmodal.tswith the following contents:
export class RentACarModal extends Modal {
    private static icon = 'https://lucid.app/favicon.ico';

    constructor(
        client: EditorClient,
    ) {
        super(client, {
            title: 'Rental Car Manager',
            url: 'angular/index.html',
            width: 800,
            height: 600,
        });
    }

    protected async messageFromFrame(message: JsonSerializable): Promise<void> {

    }
}
Here we've specified the modal's width, height, title, and the URL where the UI for the modal is being served. In this case we will be using the static asset hosting that is built in for Lucid extensions. Any static assets you put in the /rental-car-manager/public will be accessible in your extension via relative URLs. In this case we specified that there will be a file at /rental-car-manager/public/angular/index.html that should be used when loading the Modal's UI into an iFrame.
Now we can attach the modal class we created to the editor extension. Update extension.ts to look like this:
const client = new EditorClient();
const menu = new Menu(client);
const modal = new RentACarModal(client);

const showModal = () => {
    modal.show();
};
client.registerAction('showModal', showModal);

menu.addMenuItem({
    label: 'Manage Rental Cars',
    action: 'showModal',
    menuType: MenuType.Main,
    location: MenuLocation.Extension,
});
Now go back to Lucidchart, refresh the page, and hit the Rental Car Manager menu item we looked at before. You should see the following modal:
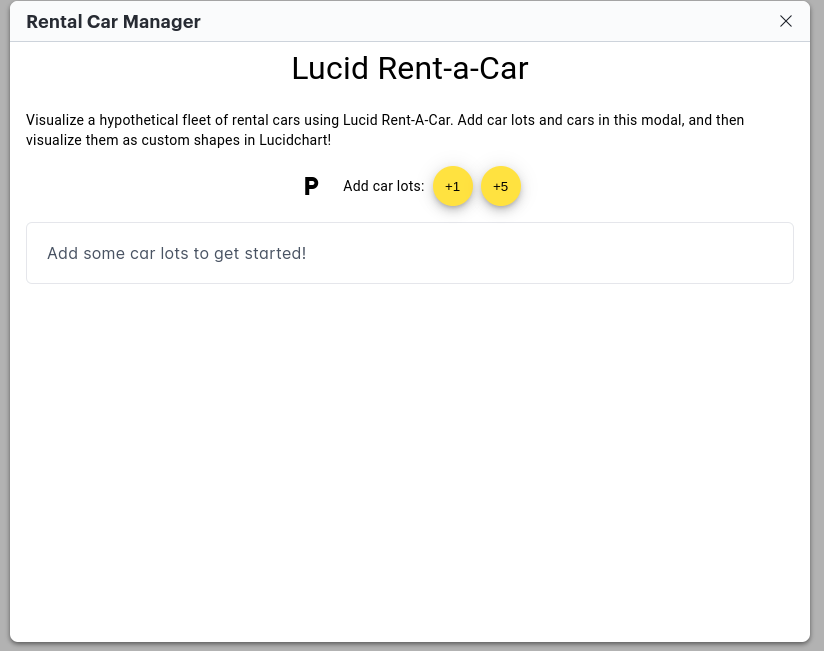
We won't be modifying the UI during this lesson, but you can look at all the code for it here. It is a standard angular application which uses window.parent.postMessage to communicate with the Lucid extension when the user presses buttons in the modal. The modal is also using Faker.js to create random data to represent the cars and car lots of our rental car fleet.
Adding data sets to the Lucidchart data linking panel
With a user interface taken care of, it's time to get some data added to Lucidchart. To get started, let's talk about how data is structured in Lucid documents.
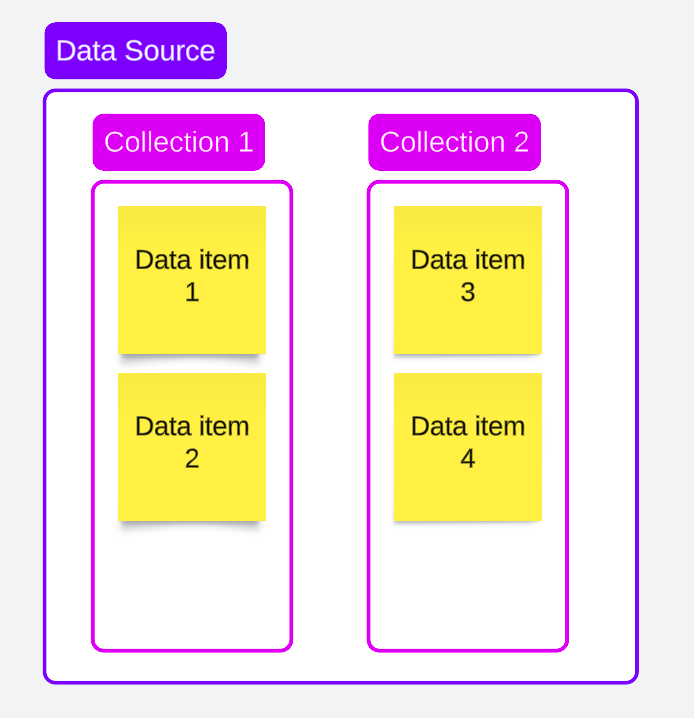
There are three layers in the hierarchy:
- Data sources - This is the outermost layer and groups data which is is related to eachother at the broadest level. An extension can use multiple data sources it it wishes, but in this case we just need one, and it will represent all of the data in the rental car fleet.
- Collections - You can think of each collection as a database table. It defines a schema that specifies all of the columns the data will have, and the types for each of those columns. In this case we will have two collections: a
Carscollection to represent each car in the rental fleet, and aLotscollection representing each of the car lots those cars are stored in. - Data items - At the lowest layer are the data items, which each represent a distinct row of data within a collection. In this case we will have a data item for each car and each car lot that the user has added through the UI.
Let's get started with the data schemas which will define our collections. Create a new file called cars.ts in the collections subfolder with the following contents:
export const CarSchema: SchemaDefinition = {
    fields: [
        {name: 'id', type: ScalarFieldTypeEnum.STRING},
        {name: 'type', type: ScalarFieldTypeEnum.STRING},
        {name: 'status', type: ScalarFieldTypeEnum.STRING},
        {name: 'make', type: ScalarFieldTypeEnum.STRING},
        {name: 'model', type: ScalarFieldTypeEnum.STRING},
        {name: 'colorName', type: ScalarFieldTypeEnum.STRING},
        {name: 'colorHex', type: ScalarFieldTypeEnum.STRING},
        {name: 'lot', type: ScalarFieldTypeEnum.STRING},
        {name: 'miles', type: ScalarFieldTypeEnum.NUMBER},
        {name: 'manufacturedDate', type: ScalarFieldTypeEnum.DATE},
        {name: 'lastServiceDate', type: ScalarFieldTypeEnum.DATE},
        {name: 'nextServiceDate', type: ScalarFieldTypeEnum.DATE},
    ],
    primaryKey: ['id'],
    fieldLabels: {
        type: 'Type',
        make: 'Make',
        model: 'Model',
        colorName: 'Color Name',
        colorHex: 'Color Hex',
        status: 'Status',
        lot: 'Lot',
        miles: 'Miles',
        manufacturedDate: 'Manufactured Date',
        lastServiceDate: 'Last Service',
        nextServiceDate: 'Next Service',
    },
};
The CarSchema specifies details about how we want the data in our cars collection to look. The fields block specifies all of the columns the data will have, and the types for those columns. The primaryKey field must point to a column (or list of columns) which will be distinct for every row of data, in this case we will use a randomly generated id field to ensure each row has a different primary key. Finally, we can specify user facing headers for the columns using fieldLabels.
Now add a second file to the collections subfolder called lots.ts with the following contents:
export const LotSchema: SchemaDefinition = {
    fields: [
        {name: 'address', type: ScalarFieldTypeEnum.STRING},
        {name: 'image', type: ScalarFieldTypeEnum.STRING},
    ],
    primaryKey: ['address'],
    fieldLabels: {
        address: 'Address',
        image: 'Image',
    },
};
Finally, let's add some handling where the editor extension receives a message from the UI in response to a user clicking one of the "Add Lots" or "Add Cars" buttons in the modal. Update rentalcarmodal.ts to look like this (cars, lots):
export class RentACarModal extends Modal {
  	private static icon = "https://lucid.app/favicon.ico";

    constructor(
        client: EditorClient,
        private dataProxy: DataProxy,
    ) {
        super(client, {
            title: 'Rental Car Manager',
            url: 'angular/index.html',
            width: 800,
            height: 600,
        });
    }

    protected async messageFromFrame(message: JsonSerializable): Promise<void> {
        if (!message || !isJsonObject(message)) {
            return;
        }

        if (isDefAndNotNull(message['cars'])) {
            const cars = message['cars'];
            if (isCarArray(cars)) {
                const collection = this.getOrCreateCarsCollection();
                collection.patchItems({
                    added: cars as Record<string, SerializedFieldType>[],
                });
            }
        }

        if (isDefAndNotNull(message['lots'])) {
            const lots = message['lots'];
            if (isLotArray(lots)) {
                const collection = this.getOrCreateLotsCollection();
                collection.patchItems({
                    added: lots as Record<string, SerializedFieldType>[],
                });
            }
        }
    }

    private getOrCreateCarsCollection(): CollectionProxy {
        return this.getOrCreateCollection(CARS_COLLECTION_NAME, CarSchema);
    }

    private getOrCreateLotsCollection(): CollectionProxy {
        return this.getOrCreateCollection(LOTS_COLLECTION_NAME, LotSchema);
    }

    private getOrCreateCollection(collectionName: string, collectionSchema: SchemaDefinition): CollectionProxy {
        const dataSource = this.getOrCreateDataSource();
        const existingCollection = dataSource.collections.find((collection) => collection.getName() === collectionName);
        if (existingCollection) {
            return existingCollection;
        }
        return dataSource.addCollection(collectionName, collectionSchema);
    }

    private getOrCreateDataSource() {
        const existingDataSource = this.dataProxy.dataSources.find(
            (dataSource) => dataSource.getName() === DATA_SOURCE_NAME,
        );
        if (existingDataSource) {
            return existingDataSource;
        }
        return this.dataProxy.addDataSource(DATA_SOURCE_NAME, {});
    }
}
Here we've added message handling for when a user adds cars or car lots via the modal. The dataProxy dependency we added in the constructor allows us to access and manage all the data on the current document. We can use it create the data source and collections we need if they don't already exist, and then when we receive messages from the iframe containing car or lot data, we can patch the collections to add the data the modal passed over.
The last step is to add a dataProxy to extension.ts and pass it into the modal constructor:
const client = new EditorClient();
...
const dataProxy = new DataProxy(client);
const modal = new RentalCarModal(client, dataProxy, documentProxy);
Now we'll make sure everything is working. Refresh your Lucidchart editor and open the rental car modal, then click on the buttons to add a few cars and lots to your collections. If you have the data linking panel open you'll be able to see the rows being added in real time:
Creating custom, data backed shapes on the canvas
With some data on the document it's time to start thinking about our visualization. There are three main components we will be using for this visualization:
- A custom shape which will be used to display specific fields of our data. Each shape will represent one car from our data.
- Some logic which creates the shapes for each car on the canvas, and groups them by their car lot
- Conditional formatting rules which will display the car's color, and flag if it's due for service based on its data
Before diving into the code, though, it makes sense to go into Lucid's editor to see if we can mock up what we'd like to see as our end result. With some visualization of what you're going for, it's much easier to complete the next steps.
For this example, we created a Lucidchart document, and came up with some mocks for the shape we wanted using the built in shapes and data linking formulas:
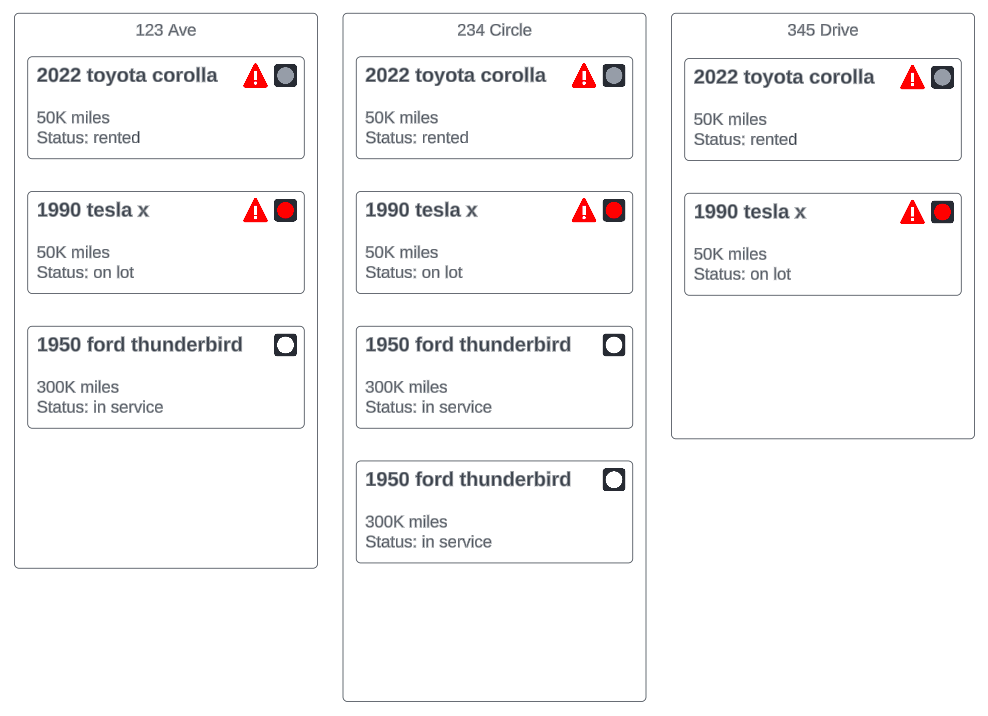
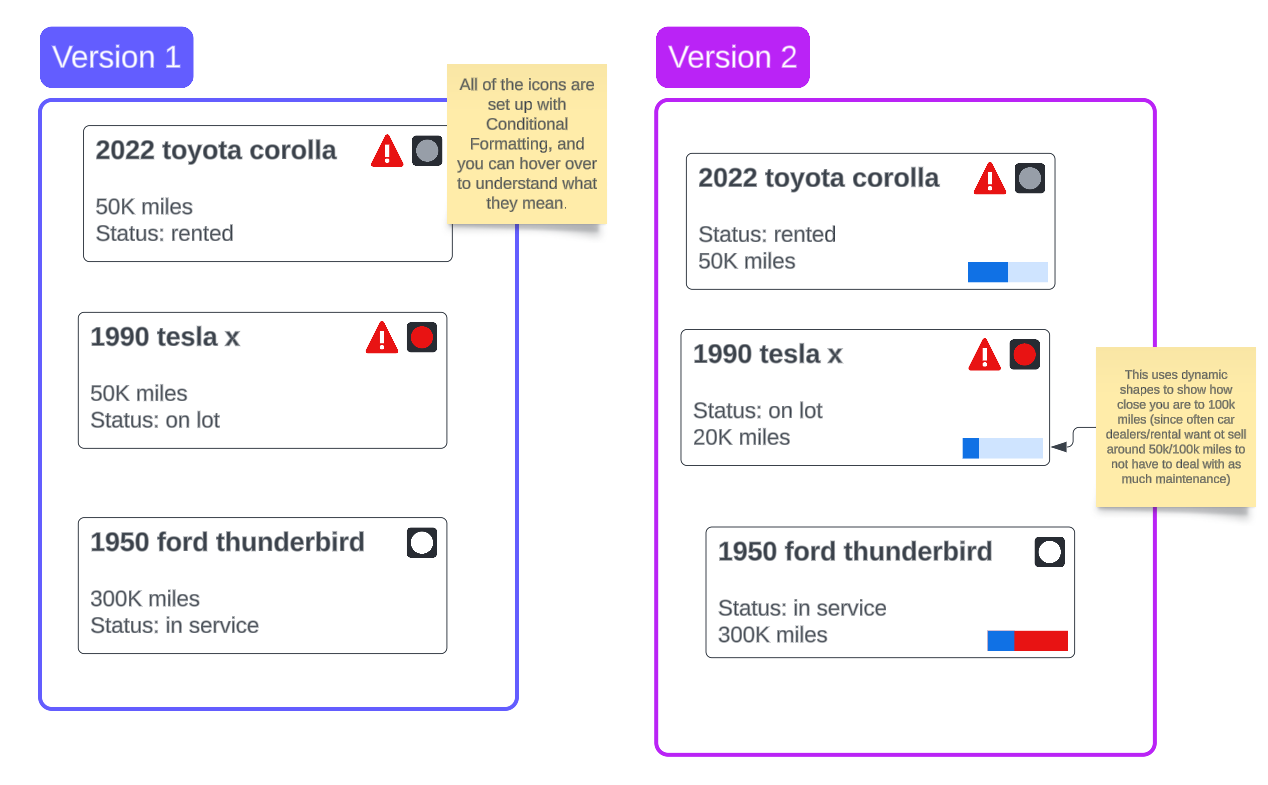 We also mocked out how we expected to lay the shapes out in groups:
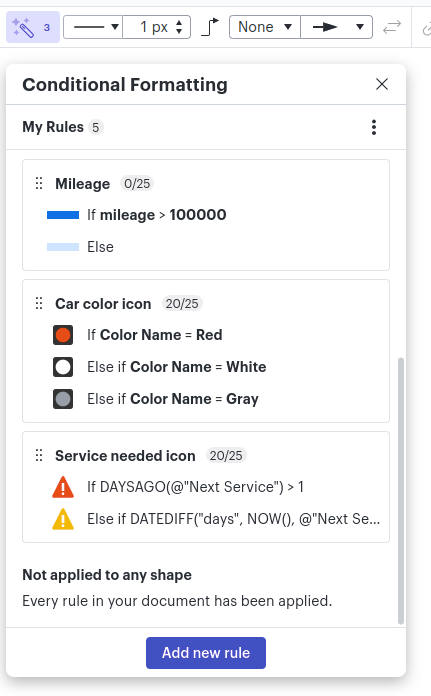
And finally we looked at conditional formatting rules that could help us flag different properties on the shapes:
Creating a custom shape
Let's start with the shape we will use for the car. Lucid applications can optionally include shape libraries which specify custom shapes for use on the canvas. To get started, we will add a file in /rental-car-manager/shapelibraries/rental-car-manager/shapes called car.shape with the following contents:
{
    "geometry": [
        {
            "type": "rect"
        }
    ],
    "shapes": [
        {
            "bounds": {
                "anchor": "top-left",
                "absolute": false,
                "x": "0.05",
                "y": "0.05",
                "w": "0.8",
                "h": "0.05"
            },
            "textarea": {
                "name": "makeAndModel",
                "text": "{{=IFERROR(YEAR(@'Manufactured Date'), 'Year') & ' ' & IFERROR(@'Make', 'Make') & ' ' & IFERROR(@'Model', 'Model')}}"
                "style": {
                    "bold": true,
                    "size": 12,
                    "sizeUnits": "pt"
                },
                "align": "left"
            }
        },
        {
            "bounds": {
                "anchor": "top-left",
                "absolute": false,
                "x": "0.05",
                "y": "0.55",
                "w": "0.9",
                "h": "0.05"
            },
            "textarea": {
                "name": "miles",
                "text": "{{=IFERROR(@'Miles', 'Unknown') & ' miles'}}"
                "style": {
                    "size": 10,
                    "sizeUnits": "pt"
                },
                "align": "left"
            }
        },
        {
            "bounds": {
                "anchor": "top-left",
                "absolute": false,
                "x": "0.05",
                "y": "0.75",
                "w": "0.9",
                "h": "0.05"
            },
            "textarea": {
                "name": "status",
                "text": "{{='Status: ' & IFERROR(@'Status', 'Unknown')}}"
                "style": {
                    "size": 10,
                    "sizeUnits": "pt"
                },
                "align": "left"
            }
        },
    ]
}
There's a few things happening here, so let's break it down.
The geometry block defines the outermost container for the shape, in our case we want the shape to be rectangular.
The shapes array contains all of the sub-shapes we will use to organize the shape. We want to have 3 different text boxes on the shape:
- A large text box with the car's year, make and model. We place this at the top of the box, set its value using a formula to lookup the data, and style it bold.
- A smaller text box further down the shape for the car's current mileage
- A final text box for the car's current status, which will indicate if the car is rented, on the lot, or getting repaired.
The last thing to do for the custom shape is add it to the shape library manifest located in /rental-car-manager/shapelibraries/rental-car-manager/library.manifest. Update its contents to this:
{
    "name": "Rental Car Manager",
    "shapes": [
        {
            "shape": "car",
            "name": "Car Shape",
            "defaults": {
                "width": 360,
                "height": 140
            }
        }
    ]
}
Now if you refresh your Lucidchart document, you should see a new shape library at the bottom of your shape libraries panel which you can drag out onto the canvas to see in action:
Additionally, if you drag a row of data onto the shape, it should populate the shape with its own data:
Creating and organizing custom shapes on the canvas
Now that we've got a custom shape to display our data, and we've also got data ready to go in our data linking panel, we're ready to tie the two together. We will want to have our editor extension create the custom car shapes when the user clicks the "Visualize" button in the UI, it should also link all the shapes up to the rows of data in the collection, and finally we should group the shapes based on their car lot and place a frame around them.
To start, let's add some code to handle when the user presses the "Visualize" button. When that happens, our modal class should receive a message with a visualize body which we can parse, and then we can load the shapes we need for later use:
export class RentalCarModal extends Modal {
  ...
  protected async messageFromFrame(message: JsonSerializable): Promise<void> {
    ...
    const visualizeBody = message["visualize"];
    if (isDefAndNotNull(visualizeBody) && isLotNodeArray(visualizeBody)) {
      await this.visualize(visualizeBody);
      this.hide();
    } else {
      console.error(visualizeBody);
    }
  }
  ...
  private async visualize(lotNodes: LotNode[]) {
    const carBlockDef = await this.loadBlockClasses();
    if (!carBlockDef) {
      this.client.alert(
        "Make sure you've enabled the Rental Car Manager shape library!",
      );
      return;
    }
  }

  private async loadBlockClasses() {
    const data = await Promise.all([
      this.client.loadBlockClasses(["ProcessBlock"]),
      this.client.getCustomShapeDefinition("rental-car-manager", "car"),
    ]);
    const [processBlock, carBlock] = data;
    return carBlock;
  }

}
Next, let's add a new dependency to the modal so it can have access to edit the contents of the document. In the rental car modal's constructor add the following:
export class RentalCarModal extends Modal {
  	private static icon = 'https://lucid.app/favicon.ico';

    constructor(
      	...
        private viewport: Viewport,
    ) {
      ...
    }

  ...
}
Then pass the document proxy in when constructing the modal:
const client = new EditorClient();
const dataProxy = new DataProxy(client);
const documentProxy = new DocumentProxy(client);
const modal = new RentalCarModal(client, dataProxy, documentProxy);
Now we can use that to figure out where to start drawing content:
export class RentACarModal extends Modal {
  //...

  private async visualize(lotNodes: LotNode[]) {
    //...
    const visibleRect = this.viewport.getVisibleRect();
    const startPoint = {
            x: visibleRect.x + BLOCK_SIZES.START_PADDING,
            y: visibleRect.y + BLOCK_SIZES.START_PADDING,
    };
  }

  //...
}
Now it's time to do some math to figure out where we need to draw everything. Add the following code to RentACarModal:
export class RentACarModal extends Modal {
  //...

  private async visualize(lotNodes: LotNode[]) {
    //...

    const { lotPositions, carPositions } = this.getLotAndCarPositions(
   		lotNodes,
   		startPoint,
  	);
  }

  private getLotAndCarPositions(
    lotNodes: LotNode[],
    startPoint: Point,
  ): {
    carPositions: Map<Car, Box>;
    lotPositions: Map<Lot, Box>;
  } {
    const lotPositions: Map<Lot, Box> = new Map();
    const carPositions: Map<Car, Box> = new Map();

    const lotY = startPoint.y;
    for (let i = 0; i < lotNodes.length; i++) {
      const lot = lotNodes[i].lot;
      const cars = lotNodes[i].cars;

      const lotX = i * (BLOCK_SIZES.LOT_WIDTH + BLOCK_SIZES.MARGIN);
      const { carPositions: lotCarPositions, bottomY } = this.getCarPositions(
        cars,
        lotX,
        lotY,
      );
      lotCarPositions.forEach((value, key) => carPositions.set(key, value));

      const lotPosition = {
        x: lotX,
        y: lotY,
        w: BLOCK_SIZES.LOT_WIDTH,
        h: bottomY - lotY,
      };
      lotPositions.set(lot, lotPosition);
    }

    return { carPositions, lotPositions };
  }

  private getCarPositions(
    carNodes: Car[],
    lotX: number,
    lotY: number,
  ): {
    carPositions: Map<Car, Box>;
    bottomY: number;
  } {
    const carPositions: Map<Car, Box> = new Map();

    const firstCarY = lotY + BLOCK_SIZES.LOT_PADDING;
    for (let i = 0; i < carNodes.length; i++) {
      const car = carNodes[i];
      const carH = BLOCK_SIZES.CAR_HEIGHT;
      const carX = lotX + BLOCK_SIZES.MARGIN;
      const carY = firstCarY + i * (carH + BLOCK_SIZES.MARGIN);

      const carBB = {
        x: carX,
        y: carY,
        w: BLOCK_SIZES.CAR_WIDTH,
        h: carH,
      };
      carPositions.set(car, carBB);
    }
    const bottomY =
      firstCarY +
      carNodes.length * (BLOCK_SIZES.CAR_HEIGHT + BLOCK_SIZES.MARGIN);

    return { carPositions, bottomY };
  }
  //...
}
This code figures out how many cars belong in each car lot, and calculates the positions and sizes of each car and each car lot such that the cars are laid out in columns like the mocks show.
Now that we know where we want everything positioned, let's do some drawing. We will start with the car lots:
export class RentACarModal extends Modal {
  //...

  private async visualize(lotNodes: LotNode[]) {
    //...

    this.drawLots(lotPositions);
  }

  private drawLots(lotBBs: Map<Lot, Box>) {
    const page = this.viewport.getCurrentPage();
    for (const [lot, lotBB] of lotBBs.entries()) {
      const lotBlock = page?.addBlock({
        className: "ProcessBlock",
        boundingBox: lotBB,
      });

      if (lotBlock) {
        lotBlock.textAreas.set("Text", lot.address);
        lotBlock.properties.set("Text_VAlign", "top");
      }
    }
  }
  //...
}
Next we can draw the cars within each lot:
export class RentACarModal extends Modal {
  //...

  private async visualize(lotNodes: LotNode[]) {
    //...

    this.drawCars(carPositions, carBlockDef);
  }

  private drawCars(carBBs: Map<Car, Box>, carBlockDef: BlockDefinition) {
    const page = this.viewport.getCurrentPage();
    for (const [car, carBB] of carBBs.entries()) {
      const carBlock = page?.addBlock({
        ...carBlockDef,
        boundingBox: carBB,
      });
    }
  }
  //...
}
The last step is to hook each car block up to a row of data. We can do that by setting the shape's reference key to point at a row from within our cars collection. Here, we're using the car's ID as a primary key to reference the row of data we want to link the shape to:
export class RentACarModal extends Modal {
  //...

  private drawCars(carBBs: Map<Car, Box>, carBlockDef: BlockDefinition) {
    const page = this.viewport.getCurrentPage();
    for (const [car, carBB] of carBBs.entries()) {
      //...

      if (carBlock) {
        carBlock.setReferenceKey("ShapeData", {
          collectionId: this.getOrCreateCarsCollection().id,
          primaryKey: `"${car.id}"`, // We wrap this in "quotes" so it's compared as a string
          readonly: true,
        });
      }
    }
  }
  //...
}
With that code in place, we're ready to demo the experience. Refresh your Lucidchart document, open the rental car manager modal, add some data, then press visualize. You should see something like this:
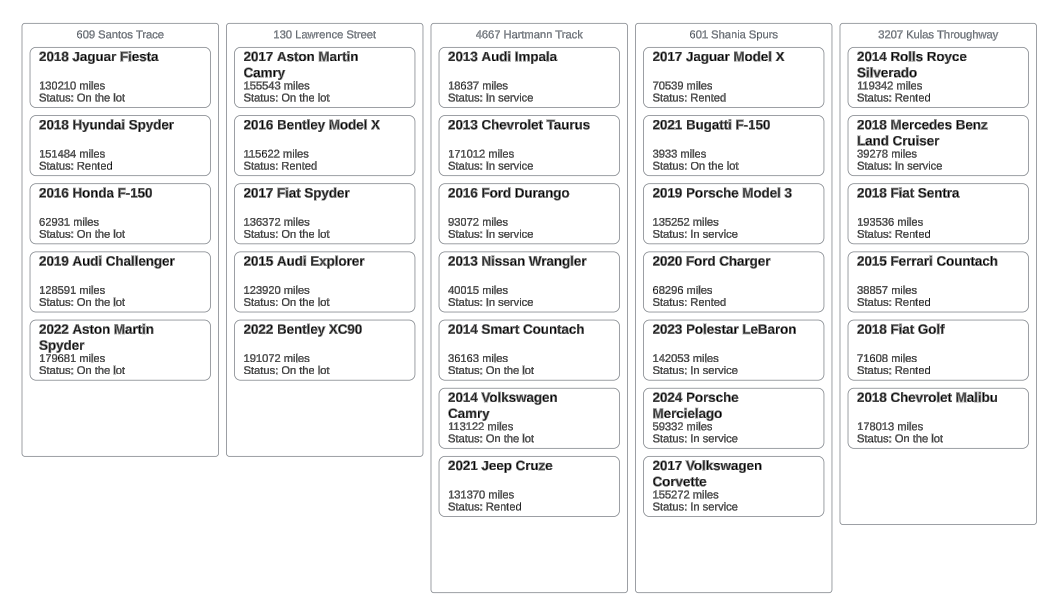
Adding conditional formatting rules
To complete our visualization we will add conditional formatting rules that will display icons on the car shapes to display their color, and whether or not they are need of service. Let's start with the car color. Add a new file in the /rules sub-directory called color.ts with the following contents:
const getColorRule: (
  colorValue: string,
  colorHash: string,
) => DataGraphicEffectDefinition = (colorValue: string, colorHash: string) => {
  return {
    conditions: [
      {
        type: ConditionType.ShapeData,
        condition: ShapeDataConditions.Equal,
        value: colorValue,
        field: "Color Name",
      },
    ],
    combination: ConditionCombination.AND,
    formatType: RuleFormattingType.DATA_GRAPHICS,
    dataGraphic: {
      set: DataGraphicIconSets.STOPLIGHTS,
      index: 0,
      color: colorHash,
      position: {
        horizontalPos: HorizontalBadgePos.RIGHT,
        verticalPos: VerticalBadgePos.TOP,
        layer: BadgeLayerPos.INSIDE,
        responsive: BadgeResponsiveness.STACK,
      },
    },
    tooltip: '=@"Color Name"',
  };
};

export const carColorRuleDefinition: RuleDefinition = {
  name: "Car color icon",
  effects: [
    getColorRule("Red", "#e81313"),
    getColorRule("White", "#ffffff"),
    getColorRule("Gray", "#979ea8"),
  ],
};

export const CAR_COLOR_RULE_NAME = "Car color icon";
This rule looks at each shape's linked data to see if the "Color Name" field matches "White", "Red", or "Gray" and if so it adds an icon in the shapes top right with the corresponding color.
Now let's add a second rule for the service indicator. Create another file in the /rules sub-directory called service.ts with the following contents:
export const serviceNeededRuleDefinition: RuleDefinition = {
  name: "Service needed icon",
  effects: [
    {
      conditions: [
        {
          type: ConditionType.Formula,
          formula: `DAYSAGO(@"Next Service") > 0`,
        },
      ],
      combination: ConditionCombination.AND,
      formatType: RuleFormattingType.DATA_GRAPHICS,
      dataGraphic: {
        set: DataGraphicIconSets.STATUS_ICONS,
        index: 1,
        color: "#e81313",
        position: {
          horizontalPos: HorizontalBadgePos.RIGHT,
          verticalPos: VerticalBadgePos.CENTER,
          layer: BadgeLayerPos.INSIDE,
          responsive: BadgeResponsiveness.STACK,
        },
      },
      tooltip: "Service overdue!",
    },
    {
      conditions: [
        {
          type: ConditionType.Formula,
          formula: `DATEDIFF("days", NOW(), @"Next Service") < 60`,
        },
      ],
      combination: ConditionCombination.AND,
      formatType: RuleFormattingType.DATA_GRAPHICS,
      dataGraphic: {
        set: DataGraphicIconSets.STATUS_ICONS,
        index: 1,
        color: "#f2ba00",
        position: {
          horizontalPos: HorizontalBadgePos.RIGHT,
          verticalPos: VerticalBadgePos.CENTER,
          layer: BadgeLayerPos.INSIDE,
          responsive: BadgeResponsiveness.STACK,
        },
      },
      tooltip: "Service soon! Due in the next 60 days.",
    },
  ],
};

export const SERVICE_NEEDED_RULE_NAME = "Service needed icon";
This rule uses a formula to check if the shape's linked "Next Service" field is already passed, or within the next 60 days. If so, the rule will add an icon to the shape.
Now we just need to add these rules to the document and apply them to the shapes. Update RentACarModal with the following changes:
export class RentACarModal extends Modal {
  //...

  private drawCars(carBBs: Map<Car, Box>, carBlockDef: BlockDefinition) {
    //...
    const rules = this.getOrCreateConditionalFormattingRules();
    for (const [car, carBB] of carBBs.entries()) {
      //...

      if (carBlock) {
        //...
        rules.forEach((ruleProxy) => carBlock.applyRule(ruleProxy));
      }
    }
  }

  private getOrCreateConditionalFormattingRules() {
    const rules: RuleProxy[] = [];

    const carColorRule =
      this.documentProxy.rules.find(
        (rule) => rule.getName() === CAR_COLOR_RULE_NAME,
      ) || this.documentProxy.addRule(carColorRuleDefinition);
    if (carColorRule) {
      rules.push(carColorRule);
    }

    const serviceNeededRule =
      this.documentProxy.rules.find(
        (rule) => rule.getName() === SERVICE_NEEDED_RULE_NAME,
      ) || this.documentProxy.addRule(serviceNeededRuleDefinition);
    if (serviceNeededRule) {
      rules.push(serviceNeededRule);
    }

    return rules;
  }
  //...
}
Now trigger another import and you should see the final product in action!
Wrapping up
You've now built a custom data visualization using Lucid's extension API. You have touched many building blocks to get here, including:
- Setting up custom UI backed by frontend frameworks like Angular
- Creating custom shapes that can be dragged onto Lucid's canvas
- Linking shapes to data and laying them out and customizing them based on their properties
These building blocks alone can be used in combination to come up with all sorts of uniquely tailored visualizations! We've only just scratched the surface of everything the Extension API can do. Don't forget to check out some of the other powerful tools your extension can leverage like calling OAuth APIs, or Synchronizing data with external sources.
Updated 5 months ago